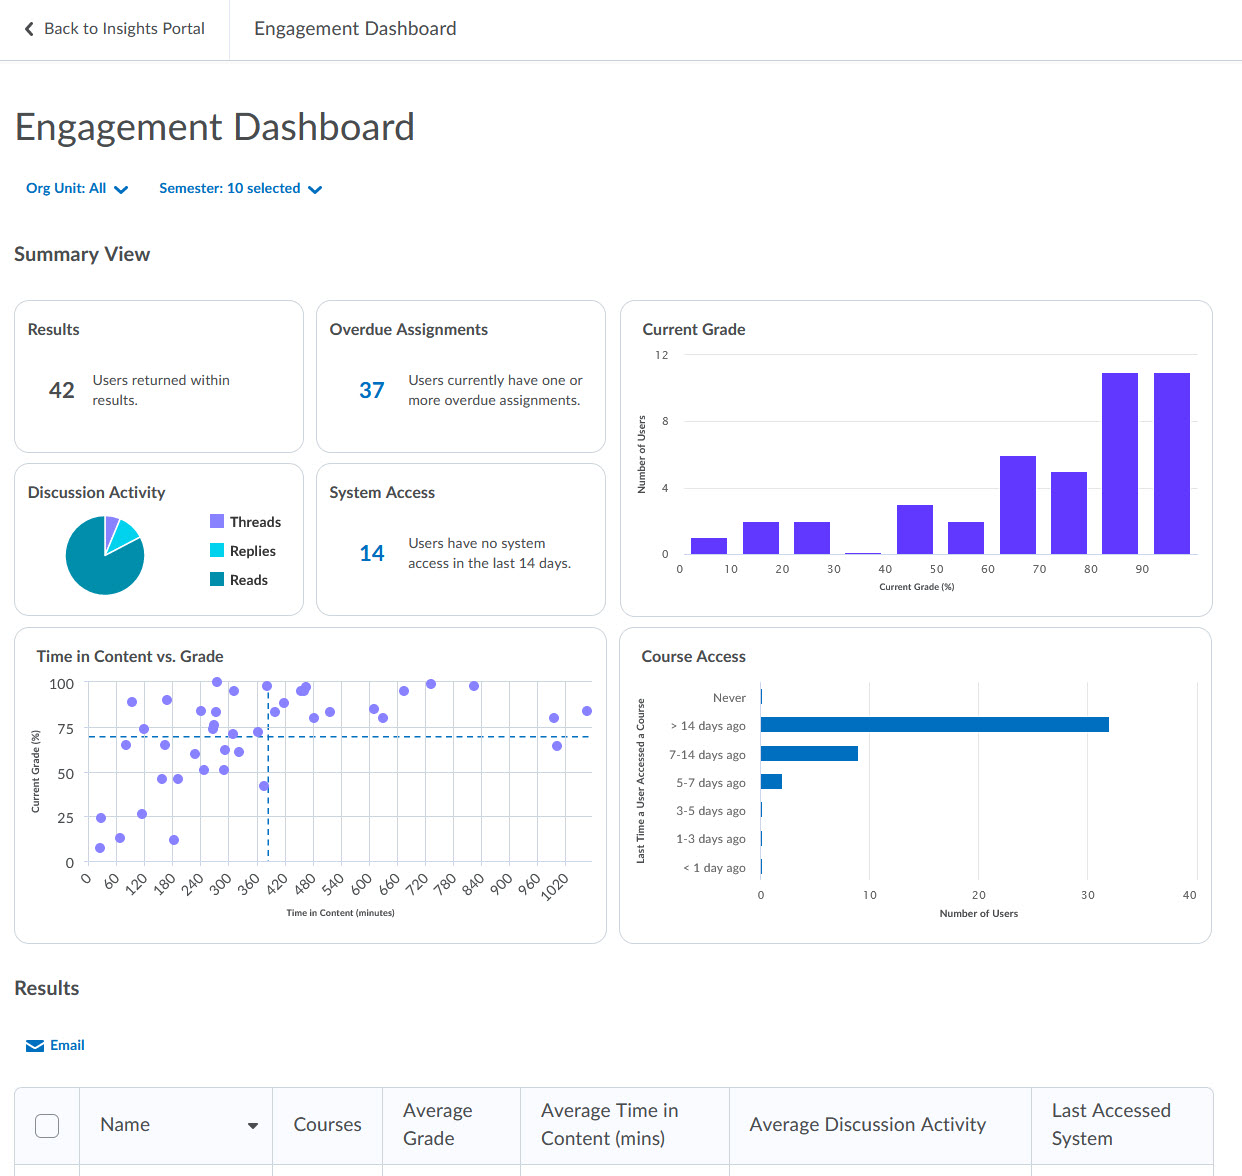
The Engagement Dashboard contains visualizations that provide insight into how students are engaging with their courses. The goal of this dashboard is to help instructors to identify at-risk students so that they can intervene and get them back on track. The information provided in the dashboard allows for individualized improvement suggestions by providing context and a holistic view of the student. By filtering out irrelevant data and combining metrics by filtering on cards, faculty can focus on their own definition of an at-risk student.
For a deeper look and a definition of statistical terms, such as Reliability Coefficient, Correlation, Discrimination Index, Top Lure, etc. visit Using the Engagement Dashboard
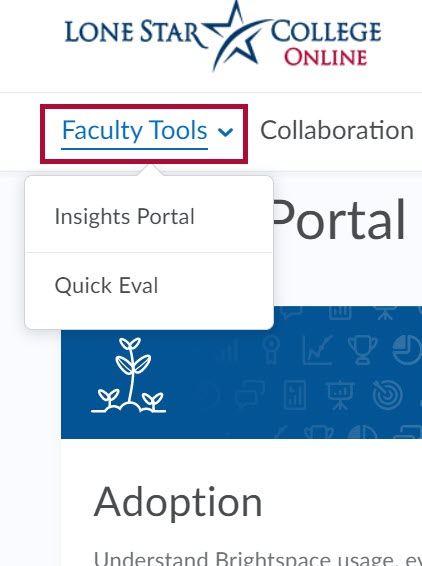
Access Insights Portal
There are two different paths to the Insights Portal:
- From the D2L homepage, click [Faculty Tools] → [Insights Portal].
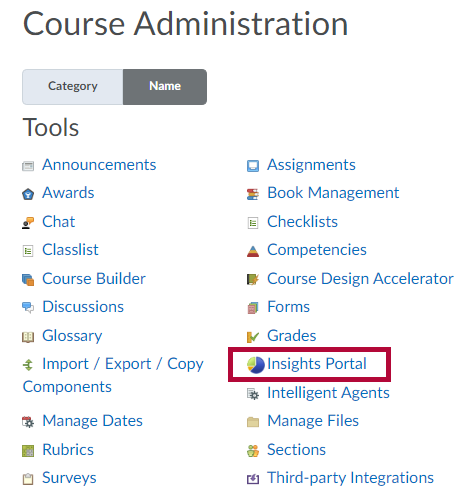
- From within a course, click [Course Management] → [Course Admin] → [Insights Portal].


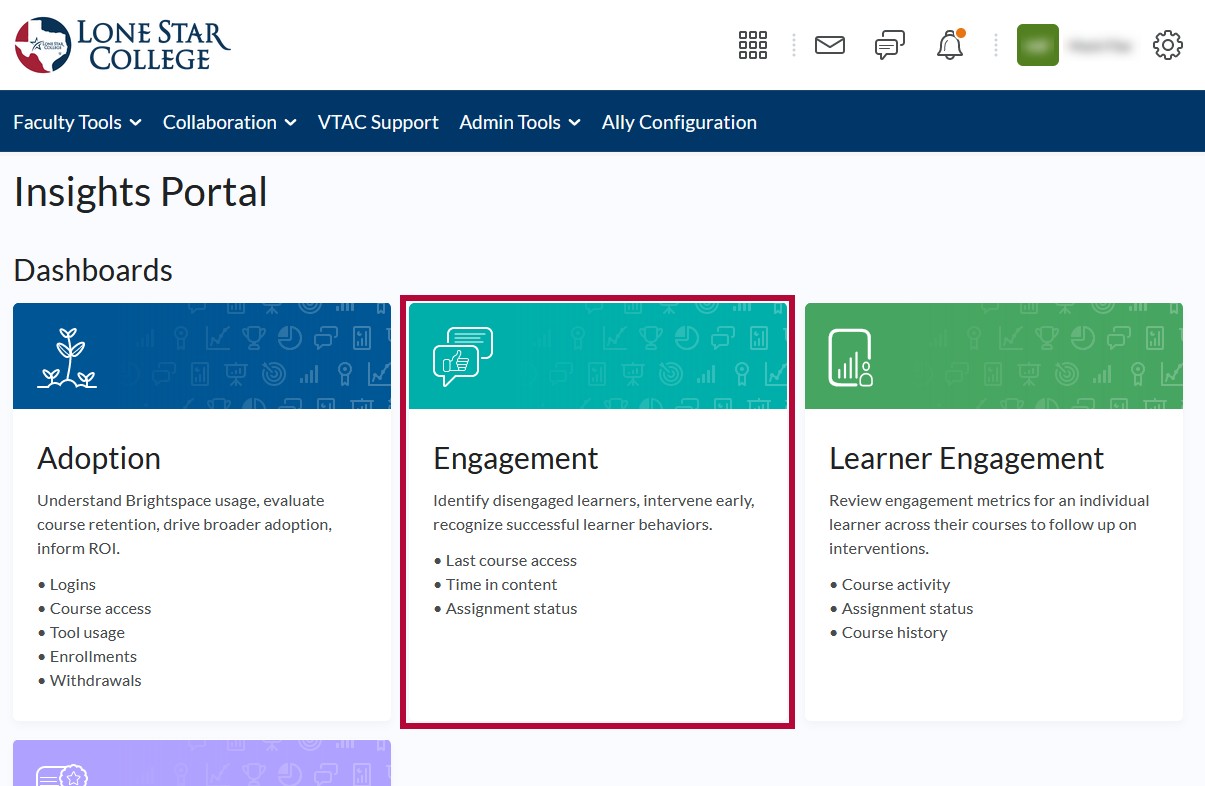
Access the Engagement Dashboard
- Once you have accessed the Insights Portal, click [Engagement].

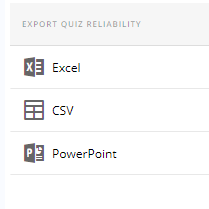
Exporting the Data
You can export the data as an Excel file, Comma Separated Values file, or a PowerPoint file.
- Click on the export icon in the upper right just above the chart.
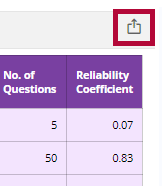
- Click on the file type you want.