The Insights Portal allows you to measure the quality of your assessments based on several metrics, including the reliability coeffiecient. To view those metrics:
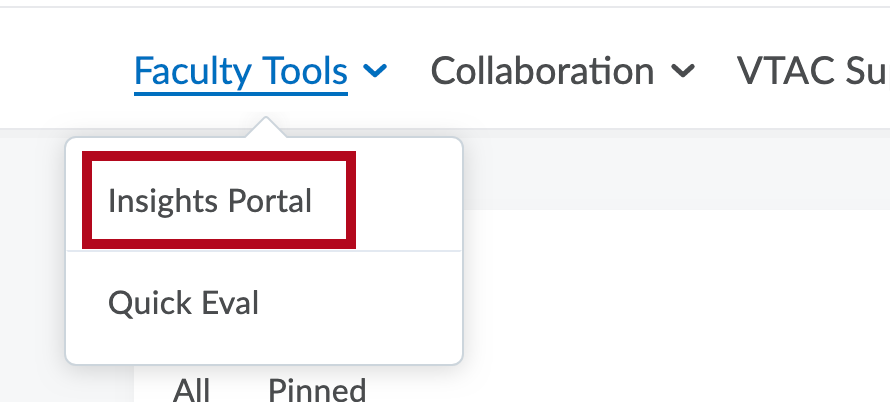
- On your D2L homepage, click on Faculty Tools in the navbar and choose Insights Portal.
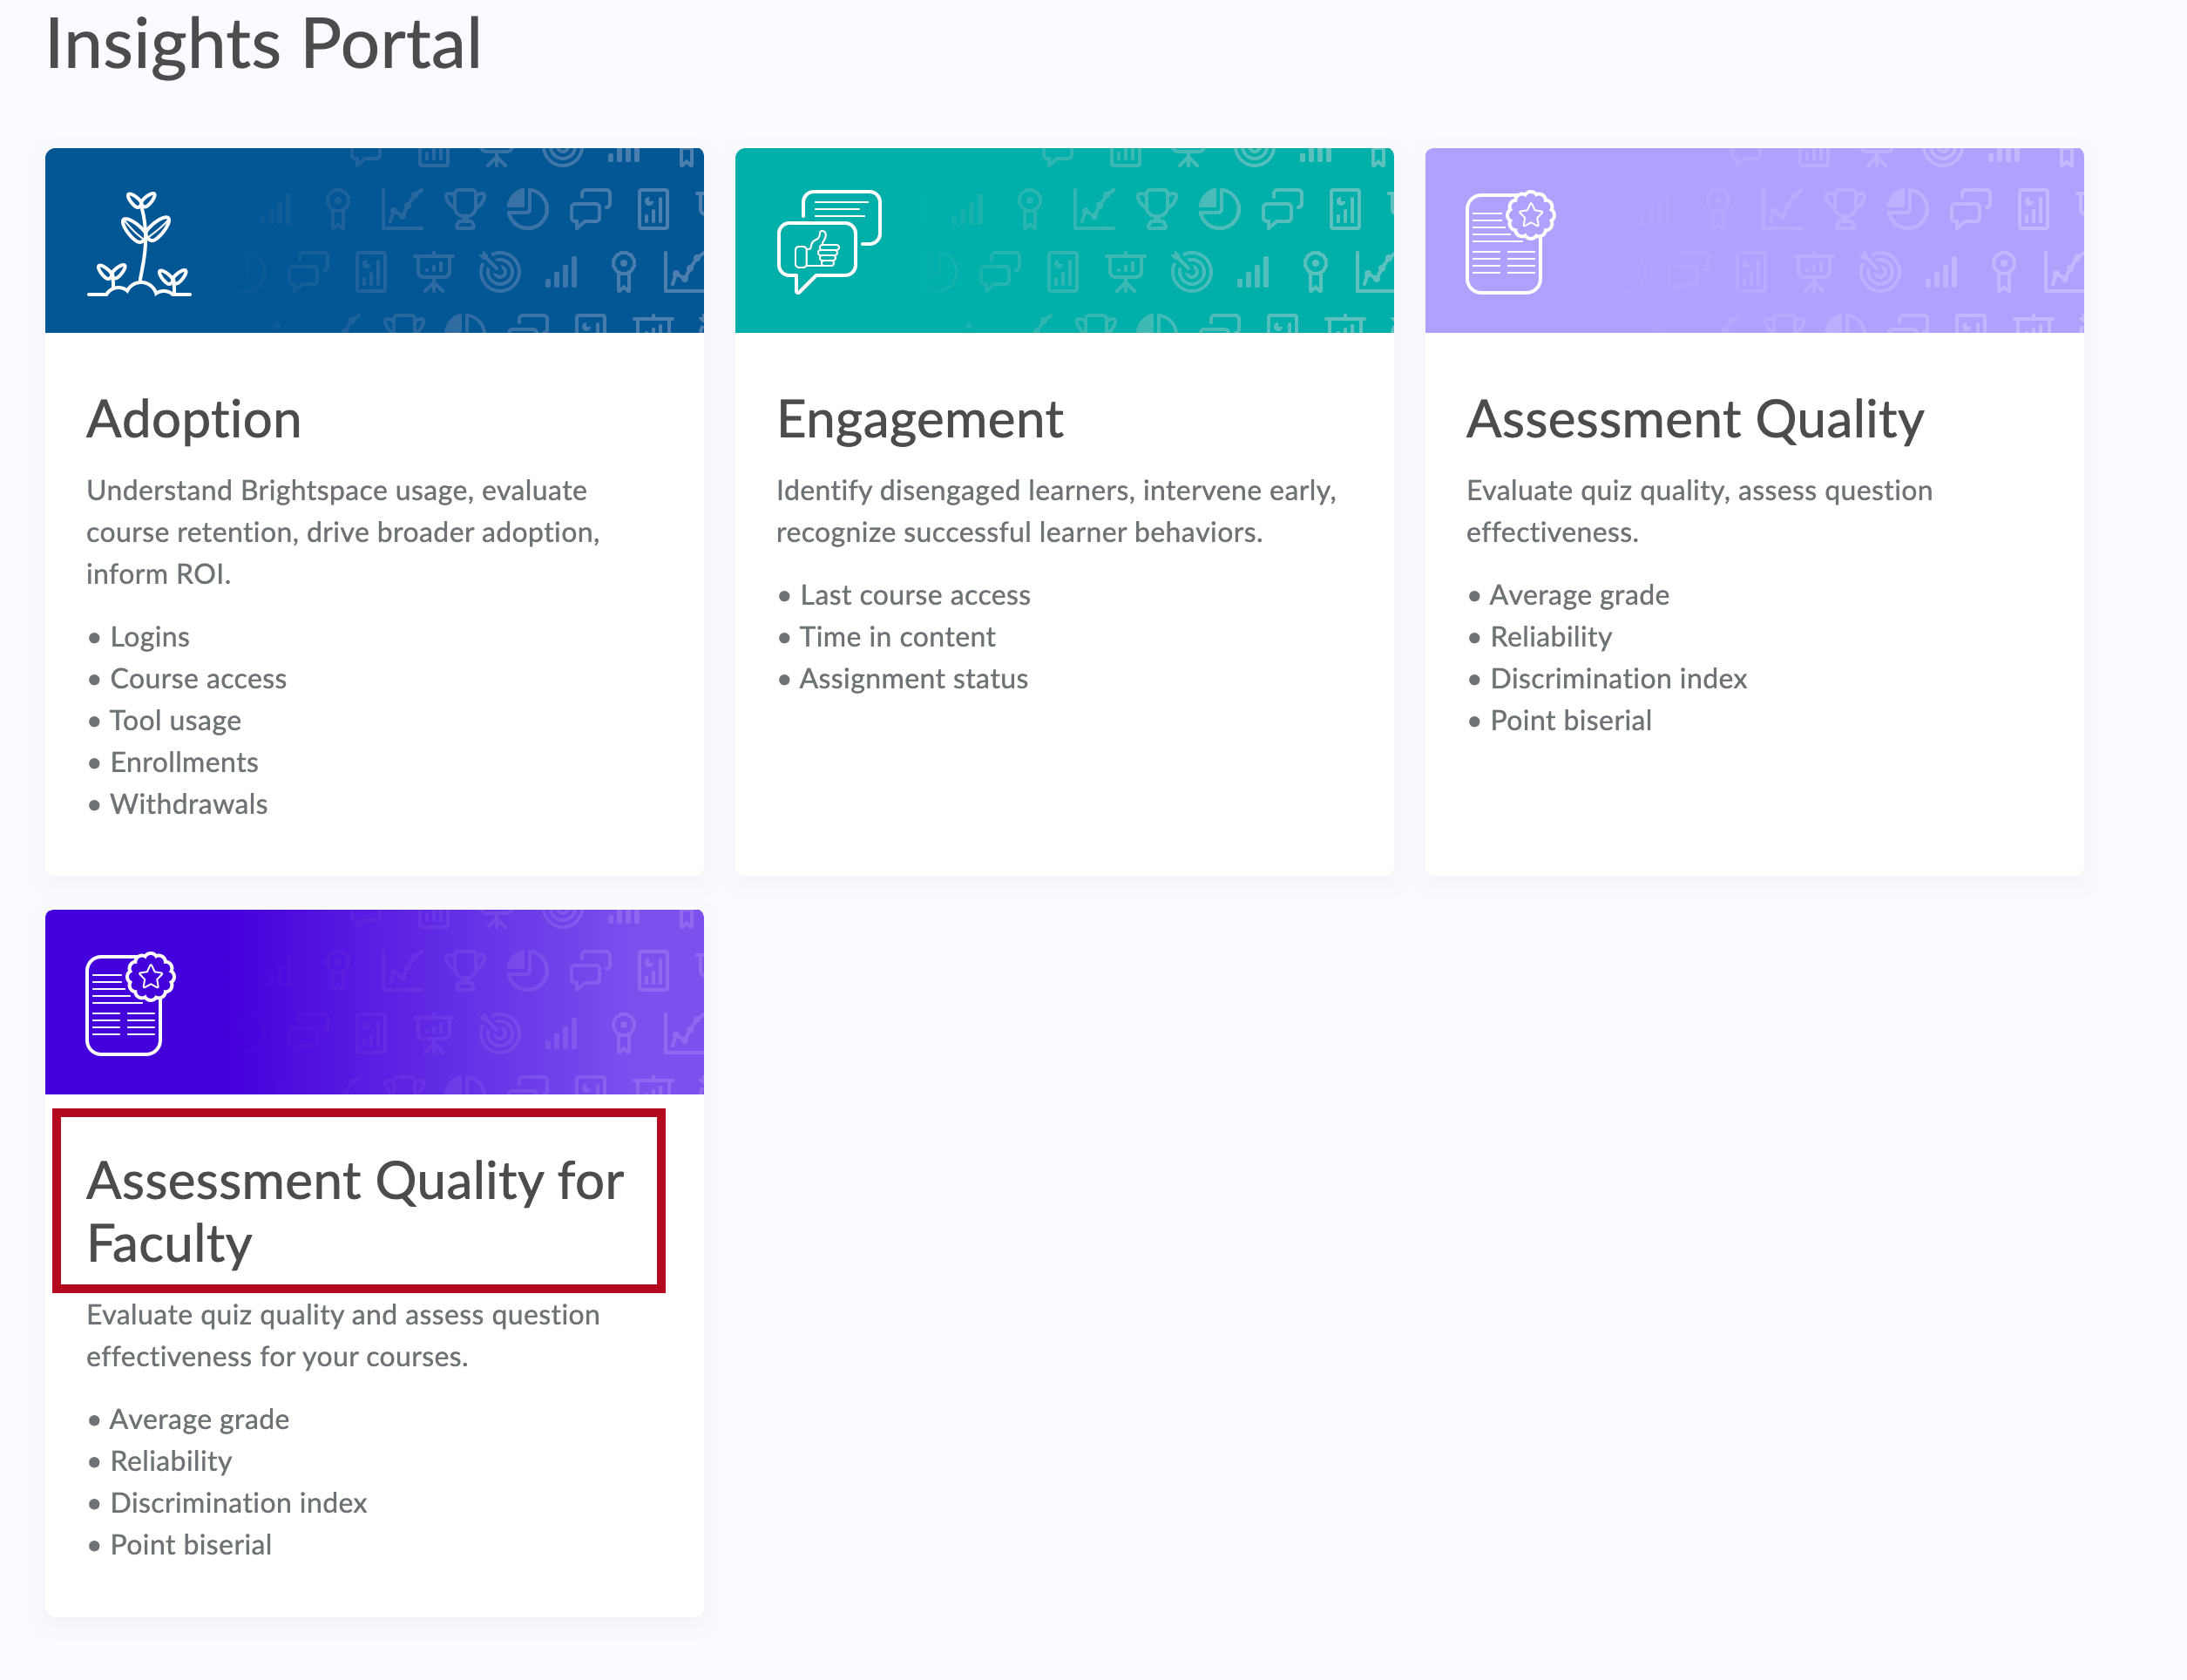
- Click on the Assessment Quality for Faculty tile.
- In the graph that appears, your courses are listed along the y-axis. The x-axis represents the quiz reliability coefficient. Each quiz will be plotted based on what course it is in and what its reliability coefficient is.
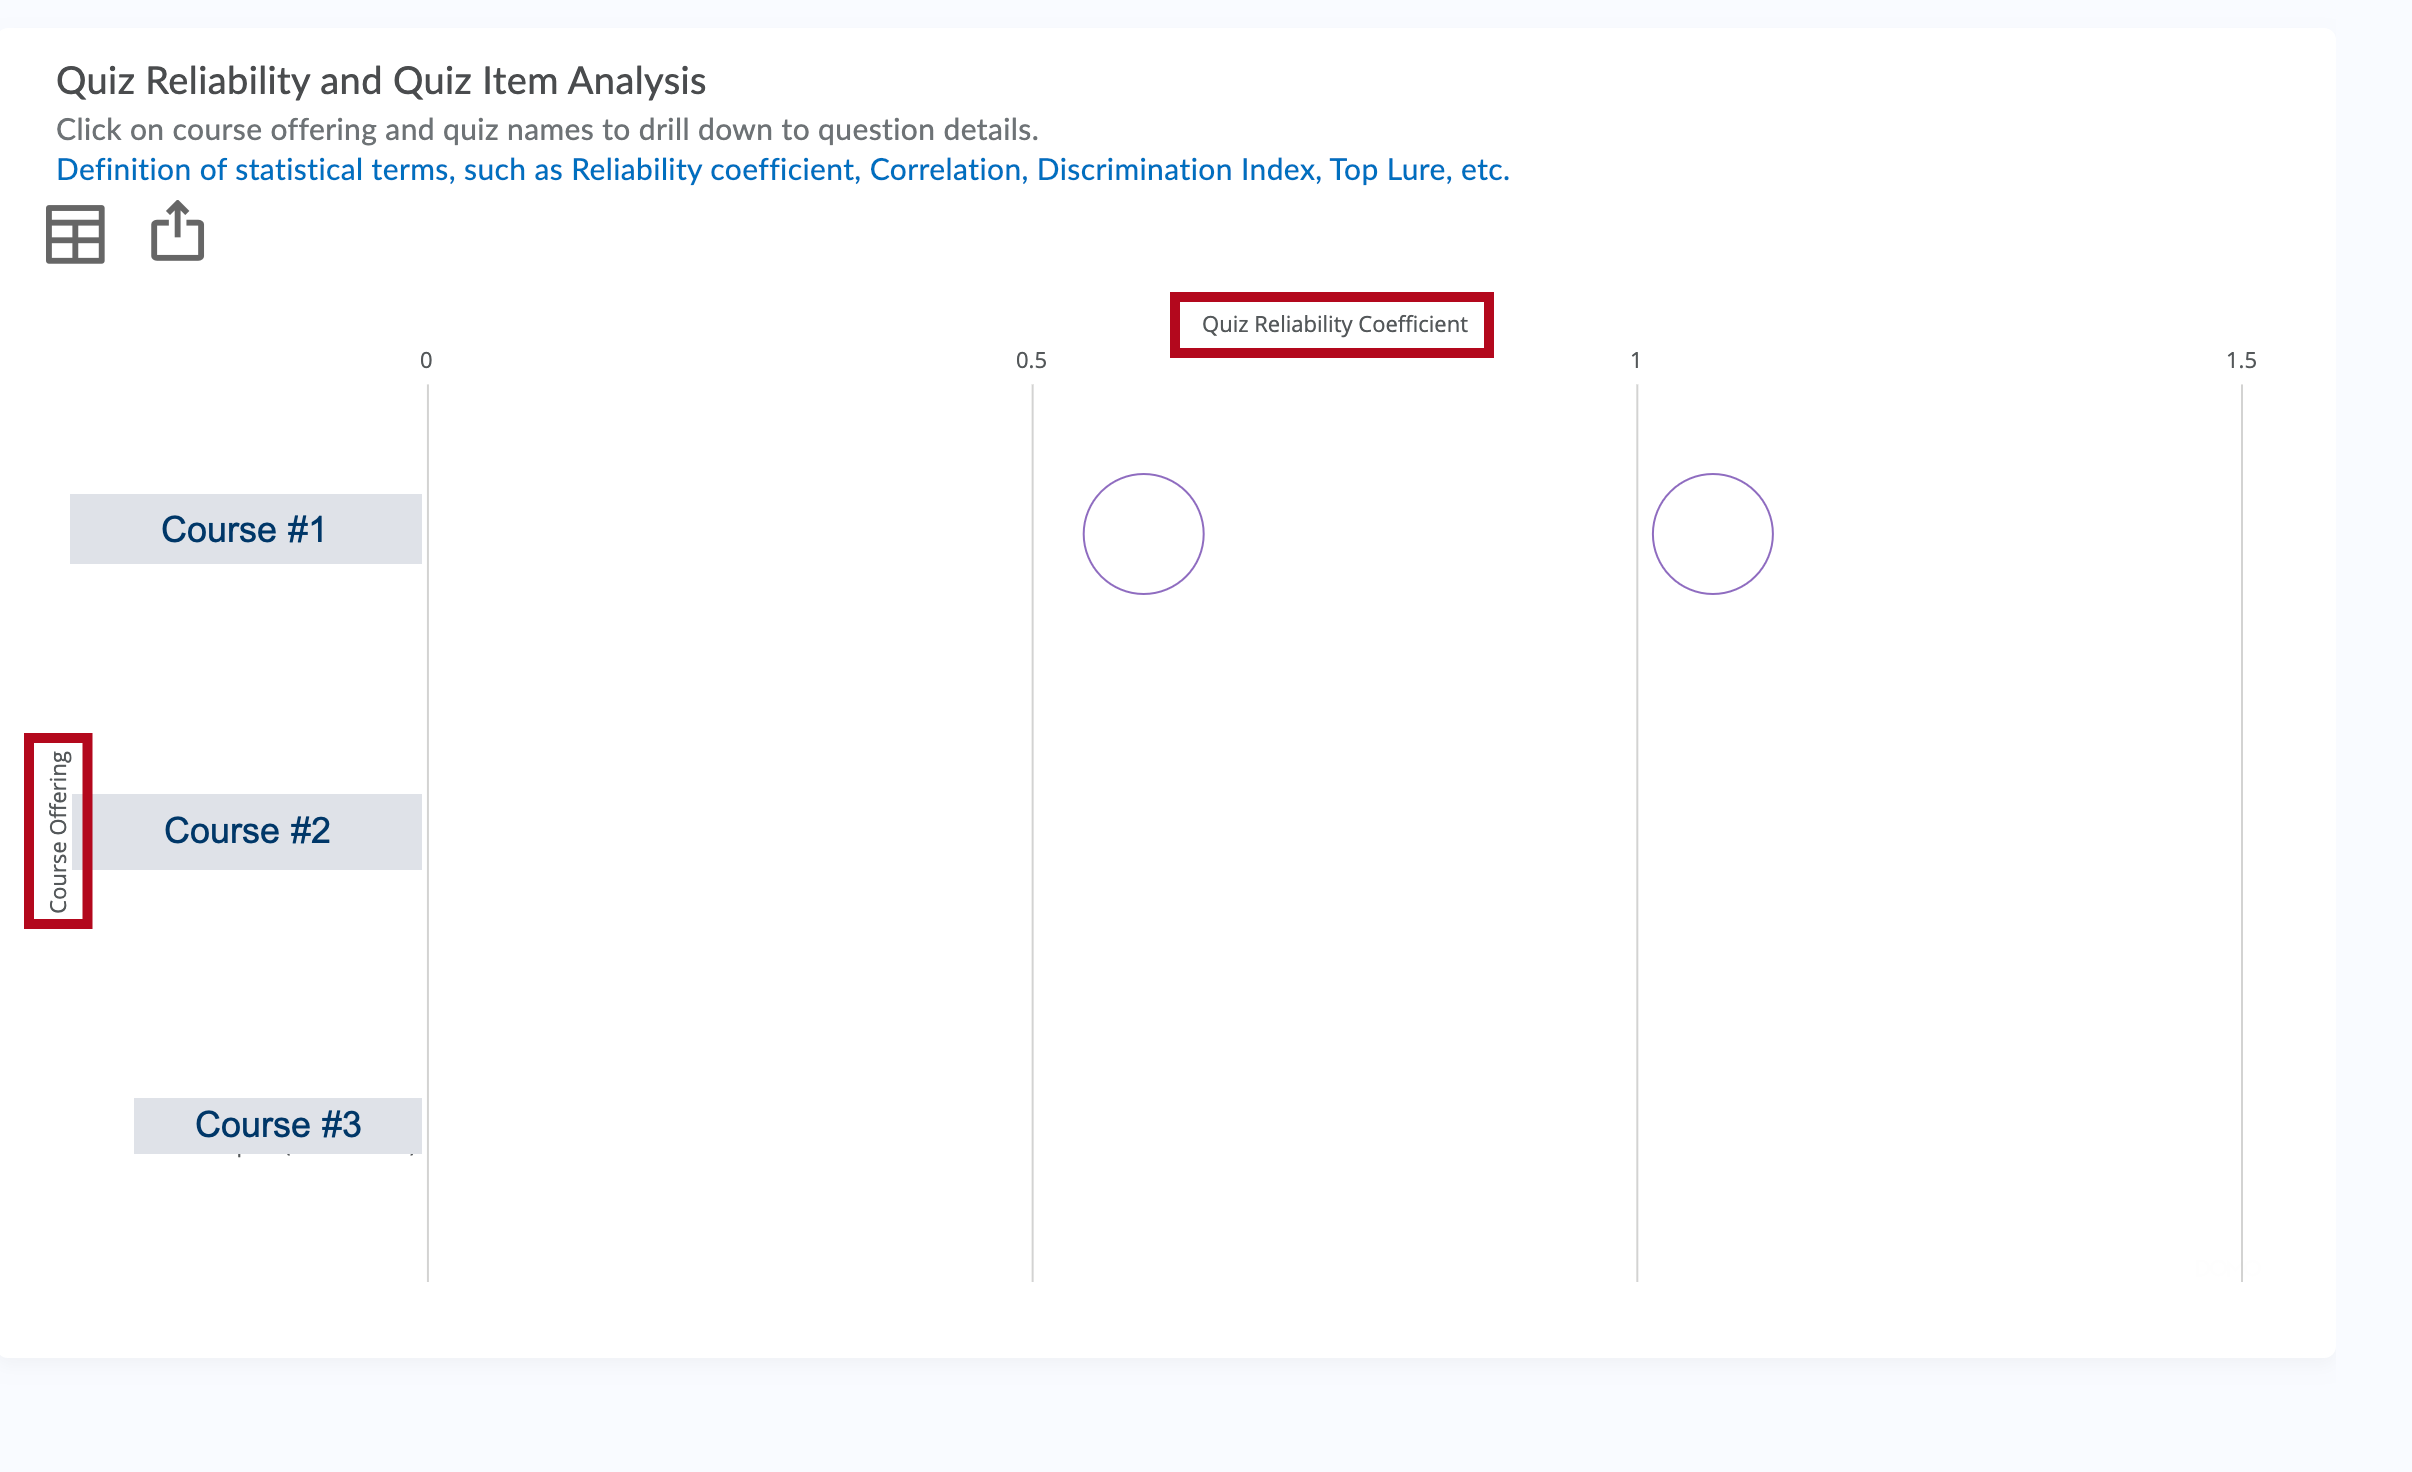
- Click on the circle for one of the quizzes to see more detail about that quiz, such as average score and number of learners.

- Click on the name of the quiz to drill down to information about the quiz questions.
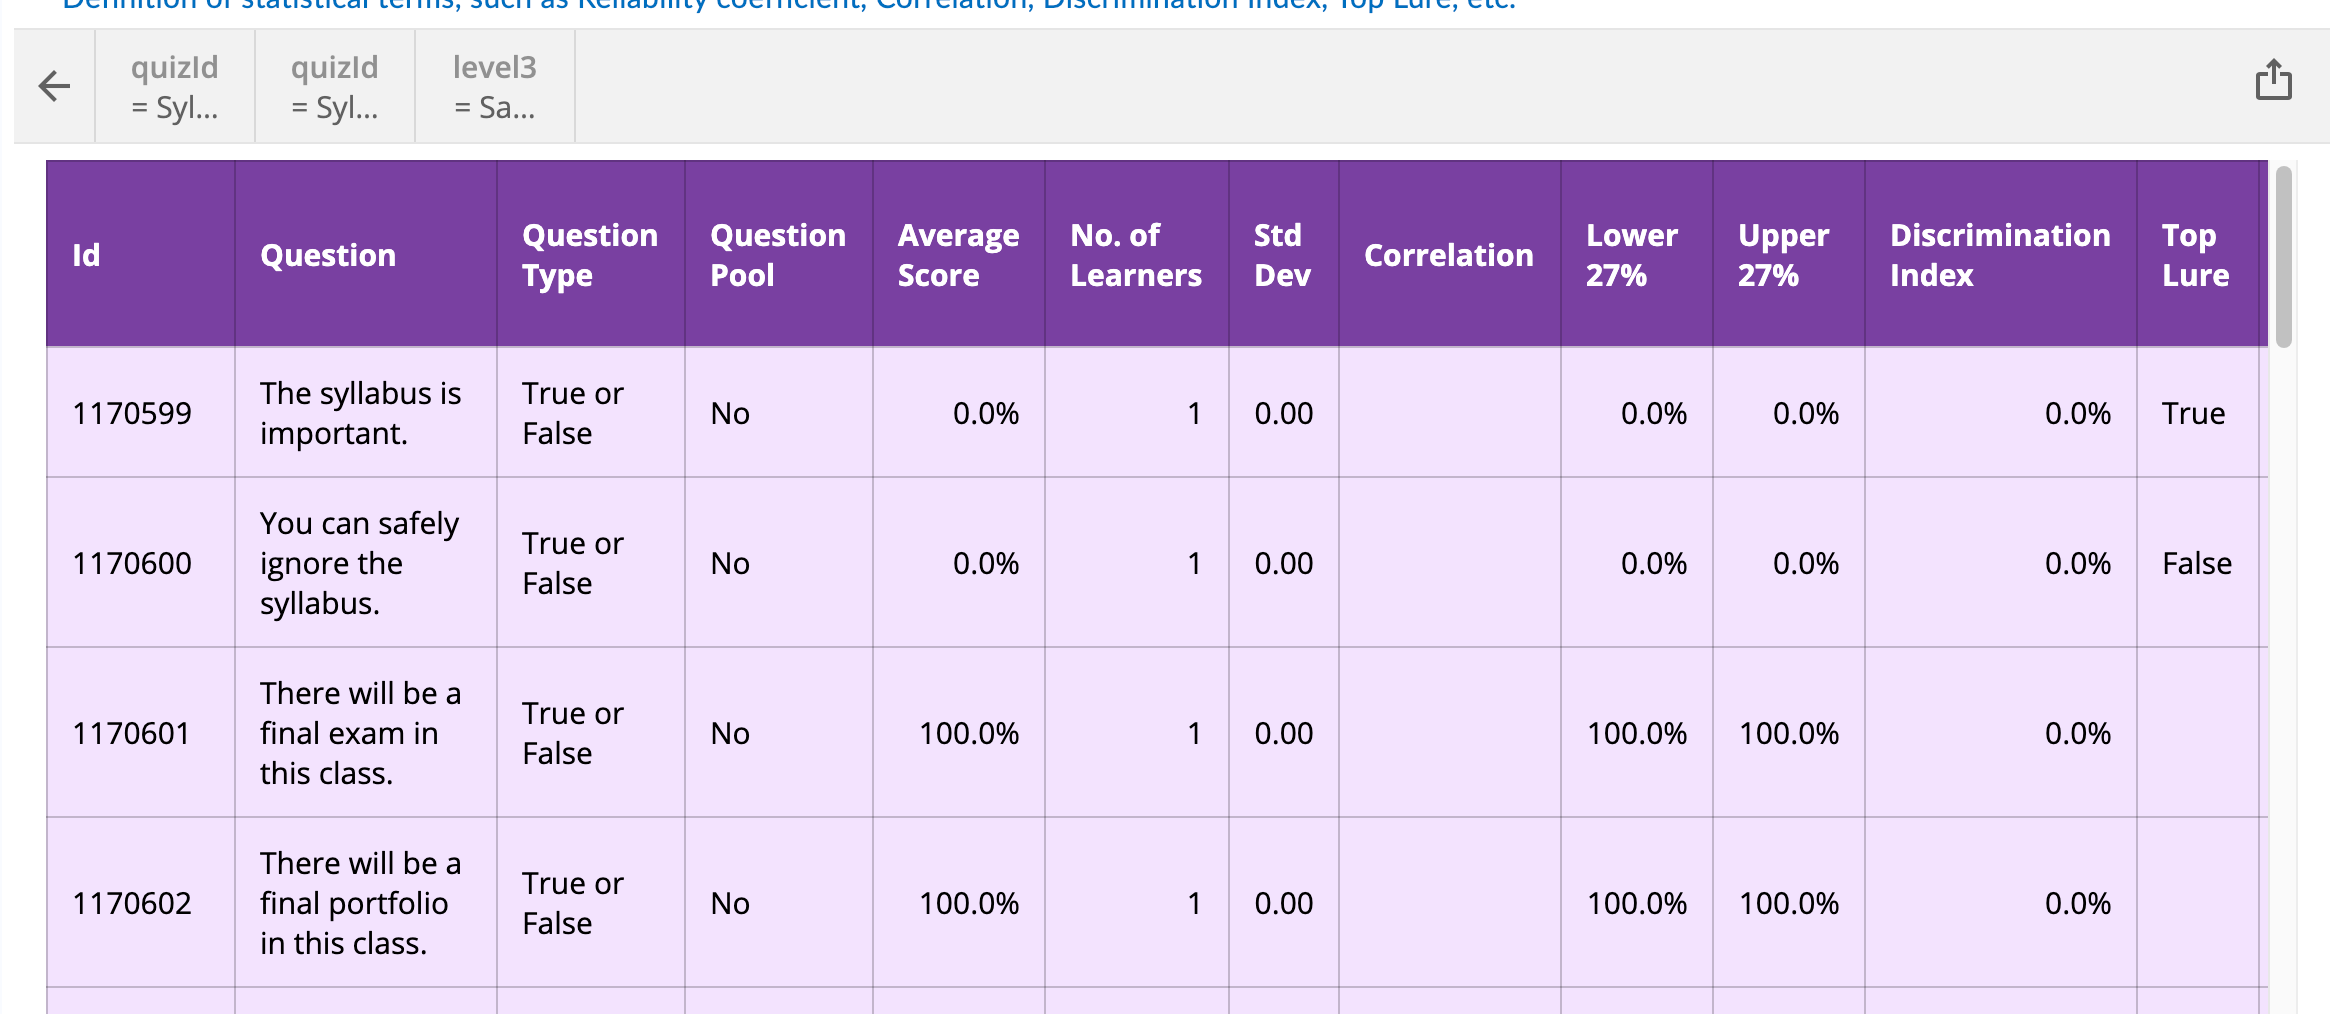
- If on any screen you would like to export the displayed data, click the Send icon.
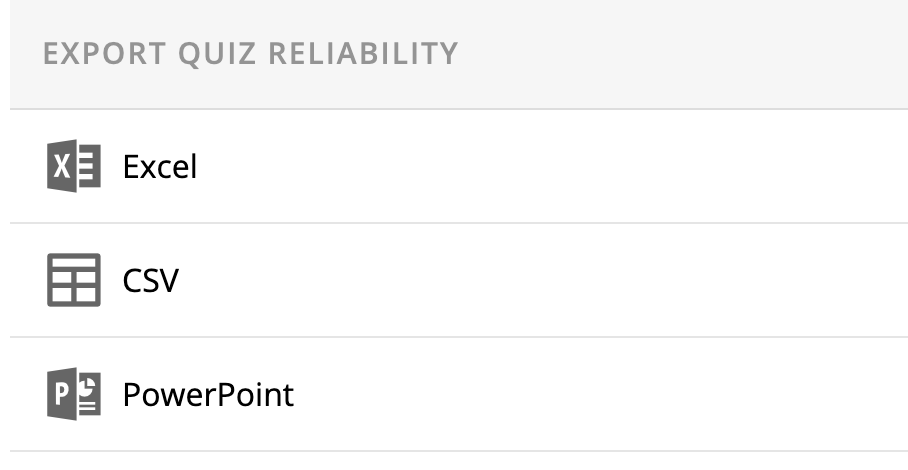
- Choose the type of file in which you'd like your data exported.
