The Faculty Assessment Quality dashboard provides a visualization to help faculty understand the quality of assessments using quiz and question statistics for quiz and question types, such as:
- Reliability
- Average grade
- Discrimination index
- Point biserial
All quizzes and questions that have had at least one quiz attempt in the last 12 months appear on the top level of the visualization. Only each student’s first attempt is included in the dashboard, as subsequent attempts bias the metrics by which quiz and question quality are measured.
For a deeper look and a definition of statistical terms, such as Reliability Coefficient, Correlation, Discrimination Index, Top Lure, etc. visit Using the Assessment Quality Dashboard.
Access Insights Portal
There are two different paths to the Insights Portal:
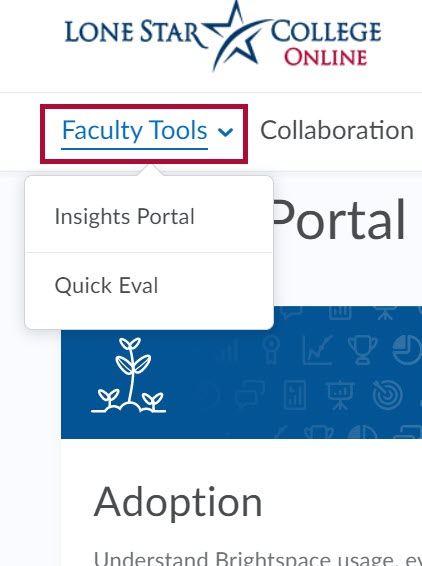
- From the D2L homepage, click [Faculty Tools] → [Insights Portal].
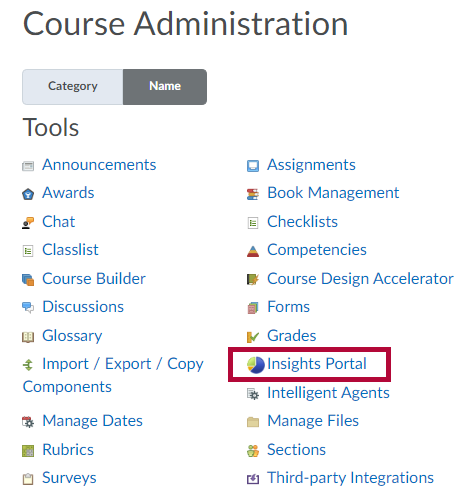
- From within a course, click [Course Management] → [Course Admin] → [Insights Portal].
Assessment Quality for Faculty
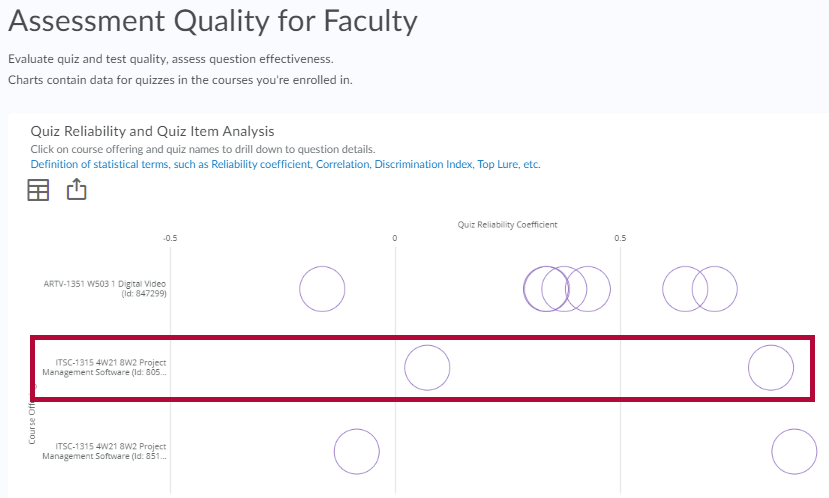
- To evaluate quiz quality and assess question effectiveness for your courses, click on [Assessment Quality for Faculty].
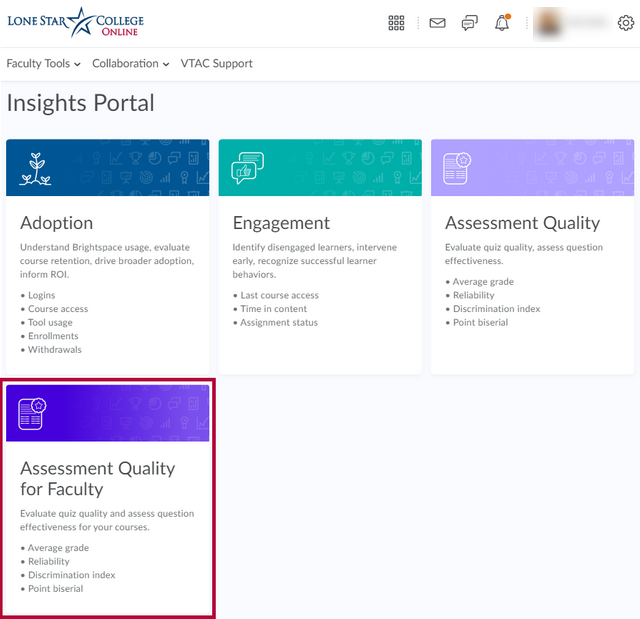
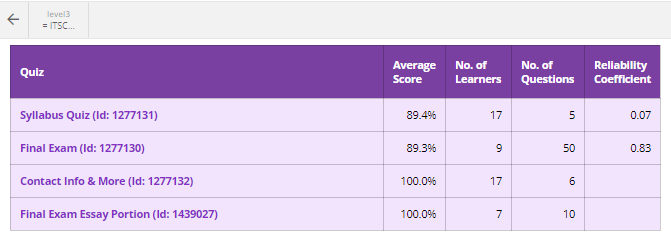
- Then click on a course to view quizzes and the following quiz statistics:
- Average grade
- Reliability
- Discrimination index
- Point Biserial
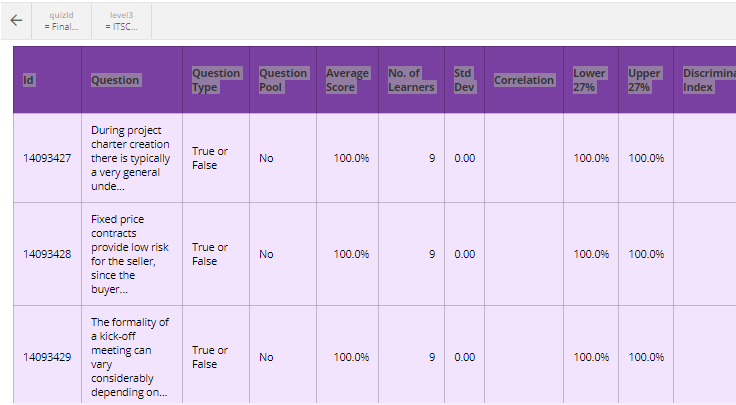
- Click on a quiz to see the questions.
- The question list shows Average Score, Standard Deviation, Correlation, and the Discrimination Index for each question.
Exporting the Data
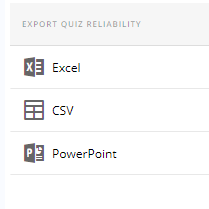
You can export the data as an Excel file, Comma Separated Values file, or a PowerPoint file.
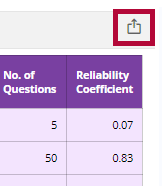
- Click on the [Export Icon] in the upper right just above the chart.
- Click on the file type you want.

